Ookla satellite figures don't compute
Last week Ookla, the company behind Speedtest, sent highlights of an analysis of satellite broadband speed.
The numbers don’t stack up.
Ookla used network performance data collected from its Speedtest service. It compared satellite broadband performance with fixed line internet performance around the world.
The analysis included New Zealand broadband.
Ookla says:
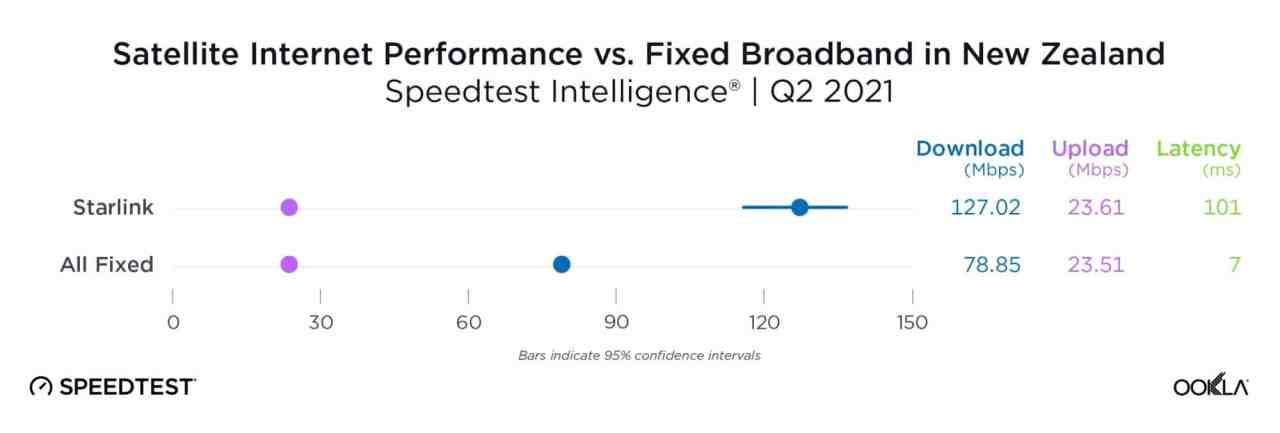
In New Zealand, Starlink is faster than fixed broadband.
Data from Speedtest Intelligence shows that Starlink’s median download speed was much faster than New Zealand’s average fixed broadband download speed during Q2 2021 (127.02 Mbps vs. 78.85 Mbps), and the upload speeds were nearly identical (23.61 Mbps vs. 23.51 Mbps).
Starlink did have a much higher latency (101 ms vs. 7 ms). Starlink is relatively new in the country and does not have a large market share yet; we’ll be interested to see how their speeds hold up under heavier use.
Contradictory numbers
This is strange. In this analysis Ookla says New Zealand’s average fixed broadband download speed is 78.85 Mbps.
Yet Ookla’s Speedtest figures for June 2021 say the average fixed broadband speed is 166.97 Mbps.
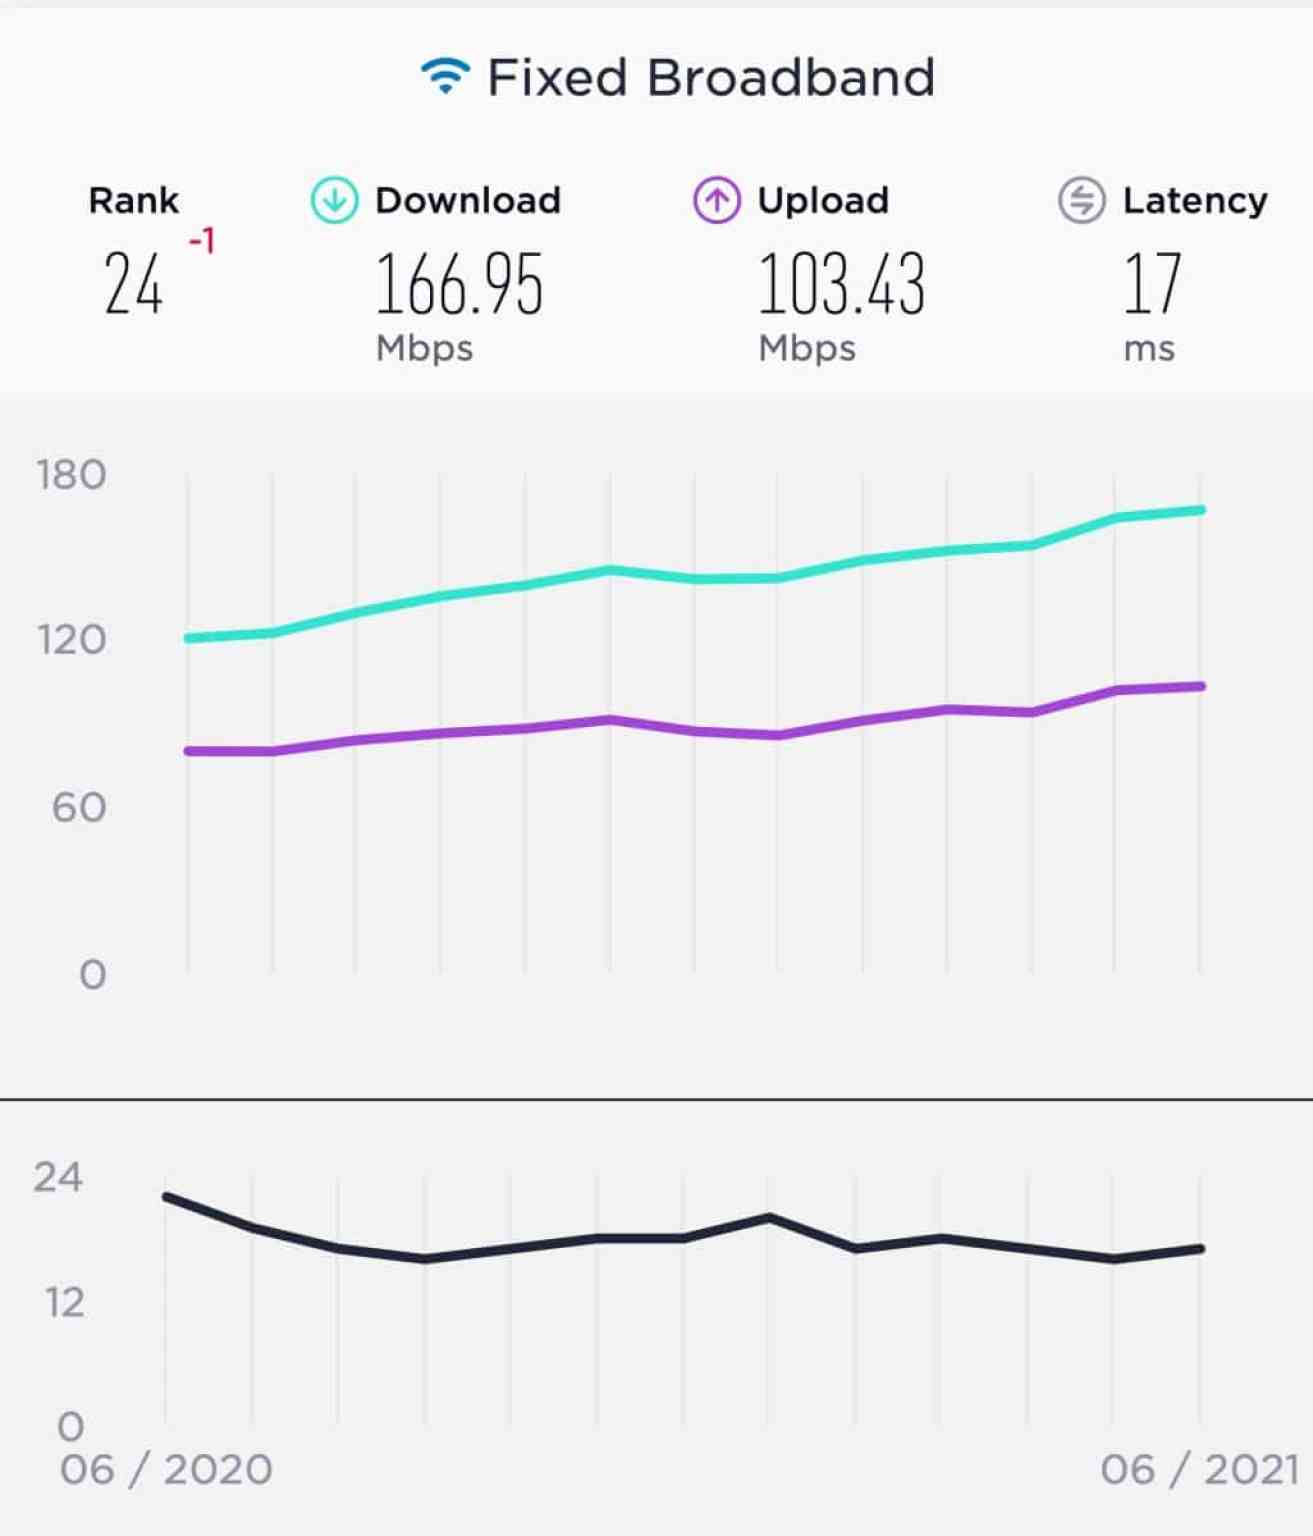
There are big differences between the two sets of download and latency measurements.
In case you missed the point, June 2021 is part of the Q2 2021 that Ookla quotes in the satellite analysis.
Even the mobile broadband speed, 83.47 Mbps, is higher that the number quoted in Ookla’s satellite analysis.
The numbers don’t stack up. Nor do they align with the lived experience of broadband performance in New Zealand.
Ookla responds
When questioned about the results in the satellite analysis, Ookla replied:
“The All Fixed Category includes every fixed speedtest across all providers. The content piece provides an overview of what the median user experiences.”
Which does not square with Ookla’s published Speedtest figures for June 2021. Presumably those numbers also include “every fixed SpeedTest across all providers”.
It’s possible Ookla has confused fixed wireless speeds with fixed broadband. That makes sense.
The Commerce Commission’s latest Measuring Broadband New Zealand report does not publish an aggregate number for all fixed-line broadband.
It separates out by plan with Fibre Max users getting an average of 842.6 Mbps and Vodafone HFC customers getting 668.5 Mbps. Fibre customers on 100Mbps plans get what it says on the box. VDSL speeds are 42.5 Mbps, fixed wireless is 25.4 Mbps and ADSL is 8.9 Mbps.
Ookla’s June 2021 result appears to be consistent with these numbers. The figure quoted for the satellite analysis is not.
Crown Infrastructure Partner’s latest quarterly broadband update says the fibre network reaches 85 percent of New Zealand premises and uptake is 65 percent. That means 55 percent of users are on fibre, almost all will have speeds greater than 100Mbps. By that standard, the median user is on fibre.
Mean or median?
In the satellite analysis Ookla uses the word ‘average’ to describe fixed broadband download speeds. An average, or mean, is what you get when you add every measurement up and divide by the number of measurements.
Ookla’s reply uses the term ‘median’. If you listed all the test results in order of speed, the one in the middle of your list would be the median.
These can be quite different when the data isn’t distributed in a Bell curve.
Yet, confusingly, Ookla describes same number as both the average and the median. The median and the mean can be the same, but that’s unlikely to be the case here.
More on broadband speeds and performance in New Zealand
Member discussion